
Census Data in The Education Trap
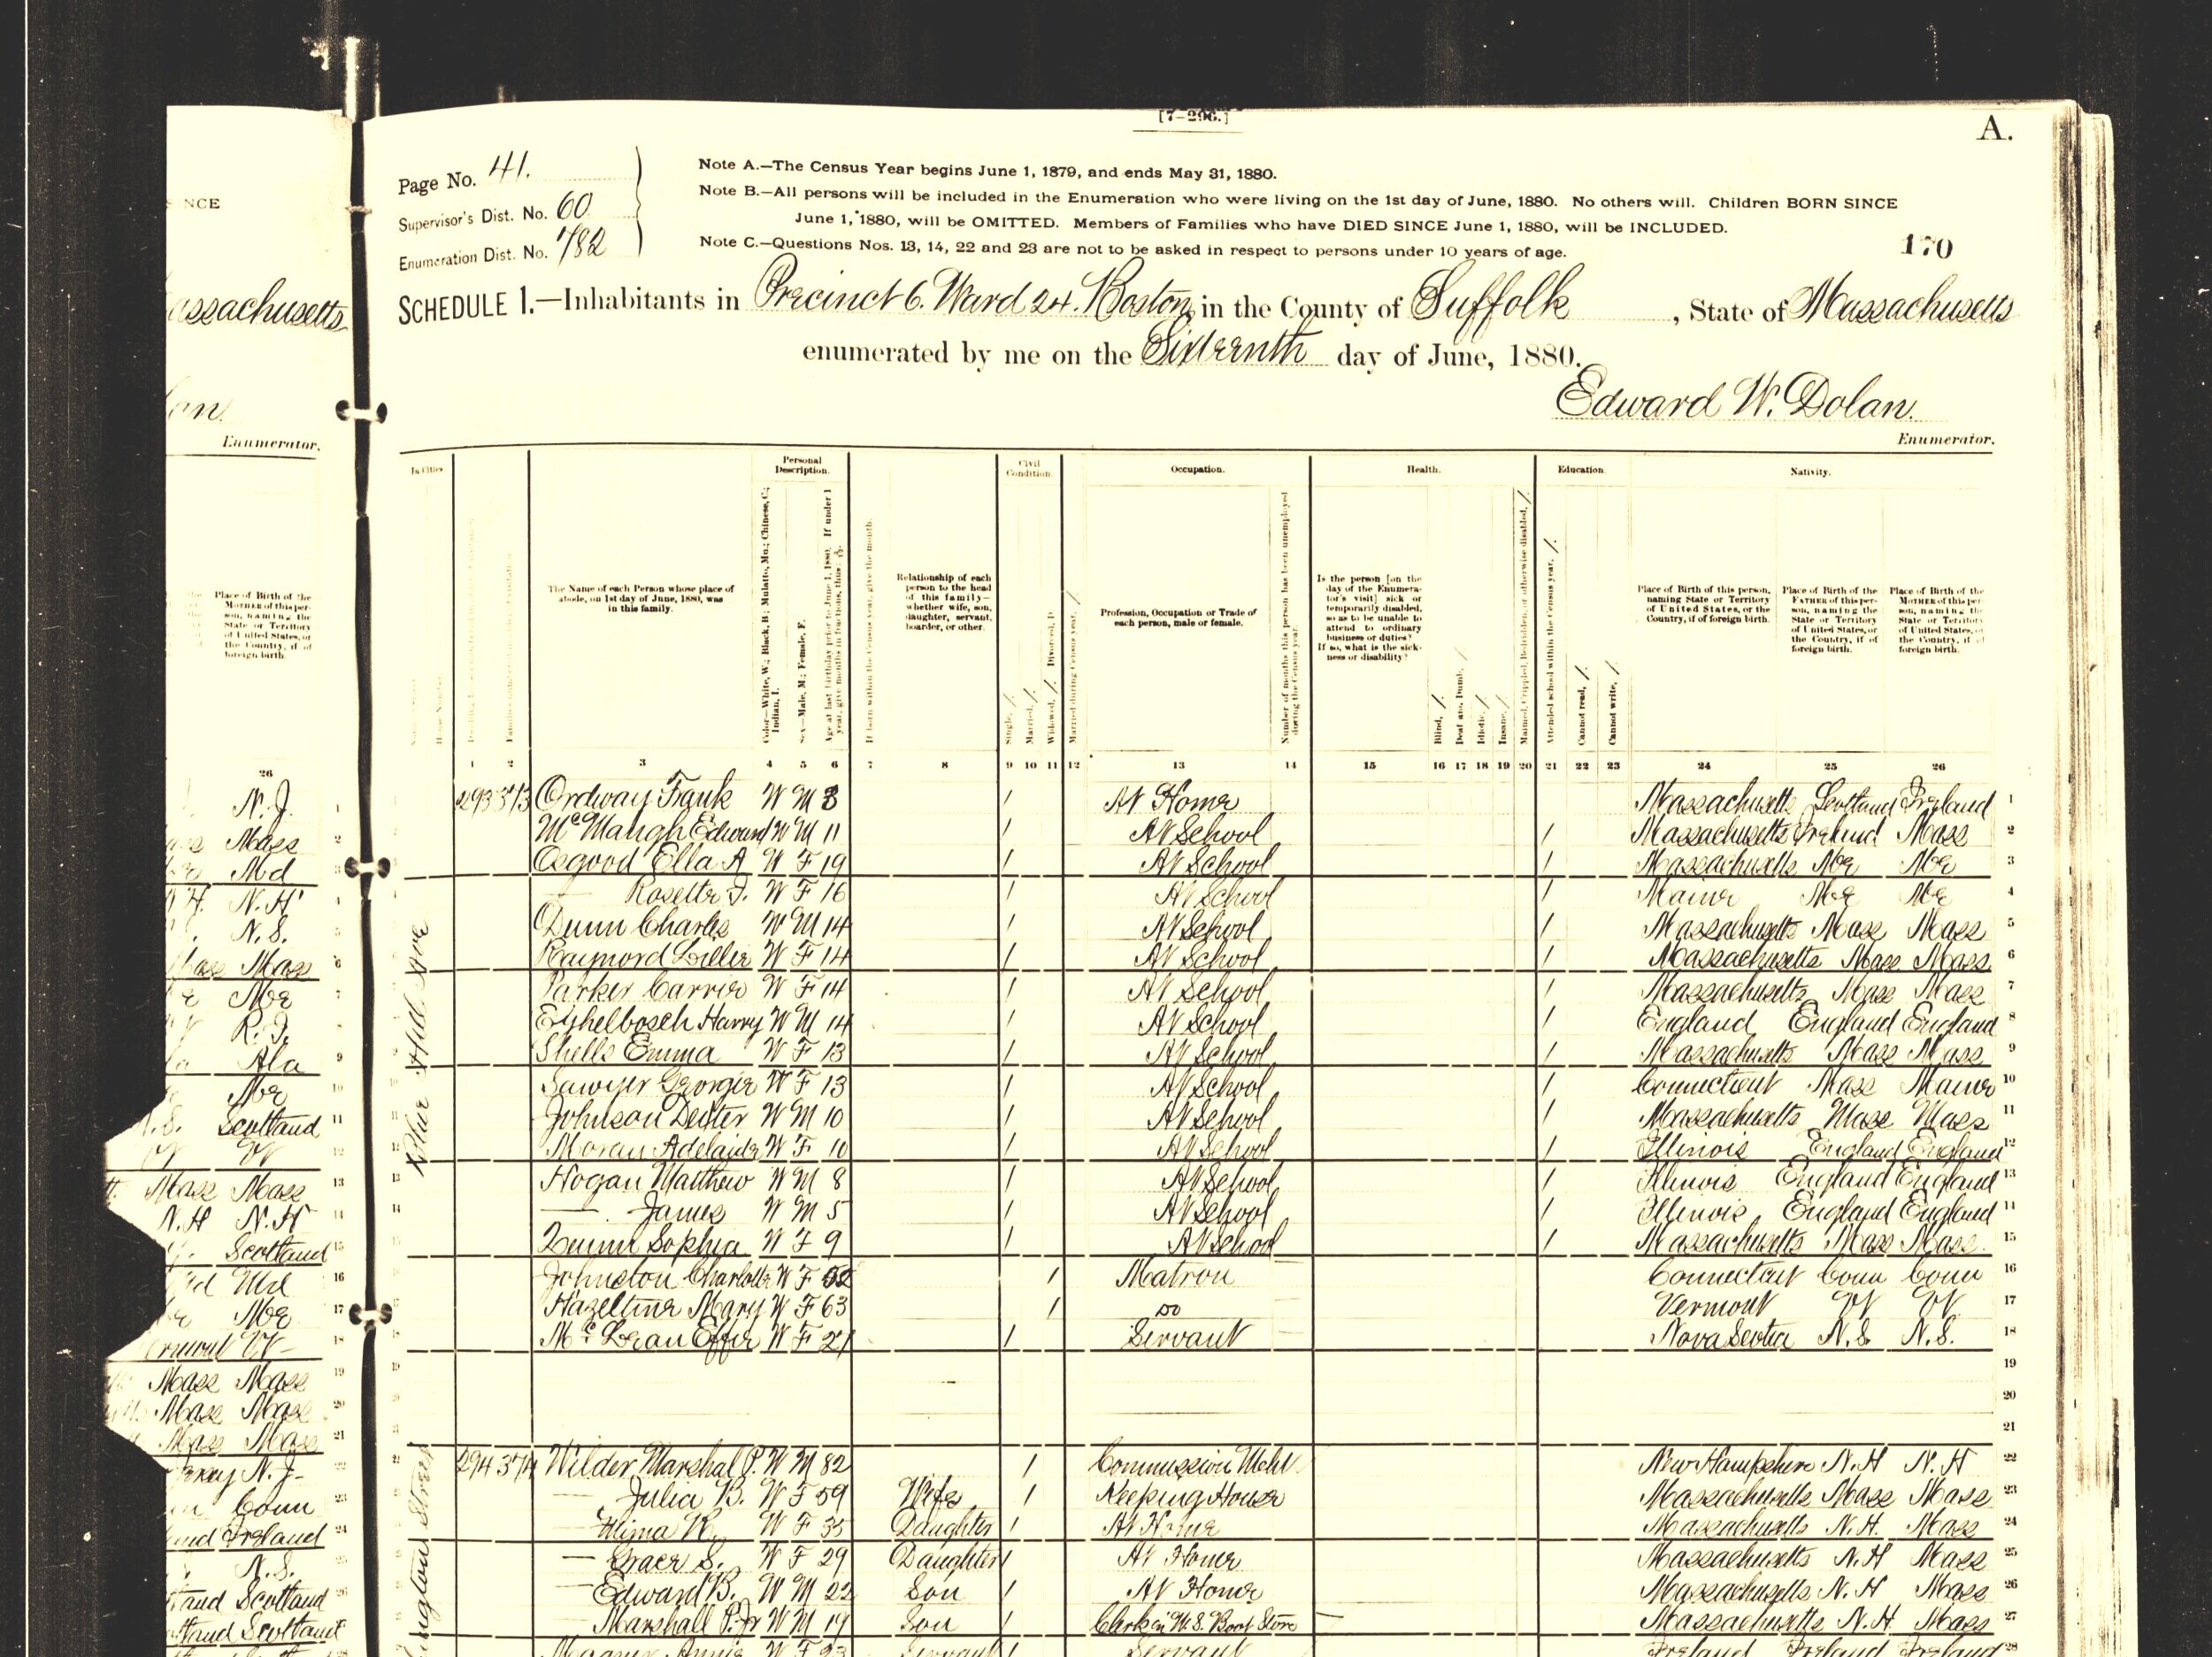
The quantitative backbone of The Education Trap is historical census data. This book is among the first monograph-length studies to use new 100% samples of IPUMS historical census microdata—individual-level data taken directly from the U.S. federal manuscript censuses—from 1880 to 1940. This dataset offers complete coverage of fine-grained demographic, occupational, and educational attributes for all individuals living in Boston through this period, and reveals, for example, the profound rise in white-collar work and school enrollment among second-generation immigrants, coupled with persistent gender, ethnic, and racial exclusion by leading professions.
Historicizing Census Data
The classification of occupations is itself historically and politically contested. Here’s how I approach occupational classifications, educational indicators, and comparability over the 1880-1940 period

Data & Codebook
Here you can access the underlying data used in this book, as well as the codebook that details the samples, variables, and coding I used to interpret Boston’s transformation in the decades between 1880 and 1940.
Data Visualizations
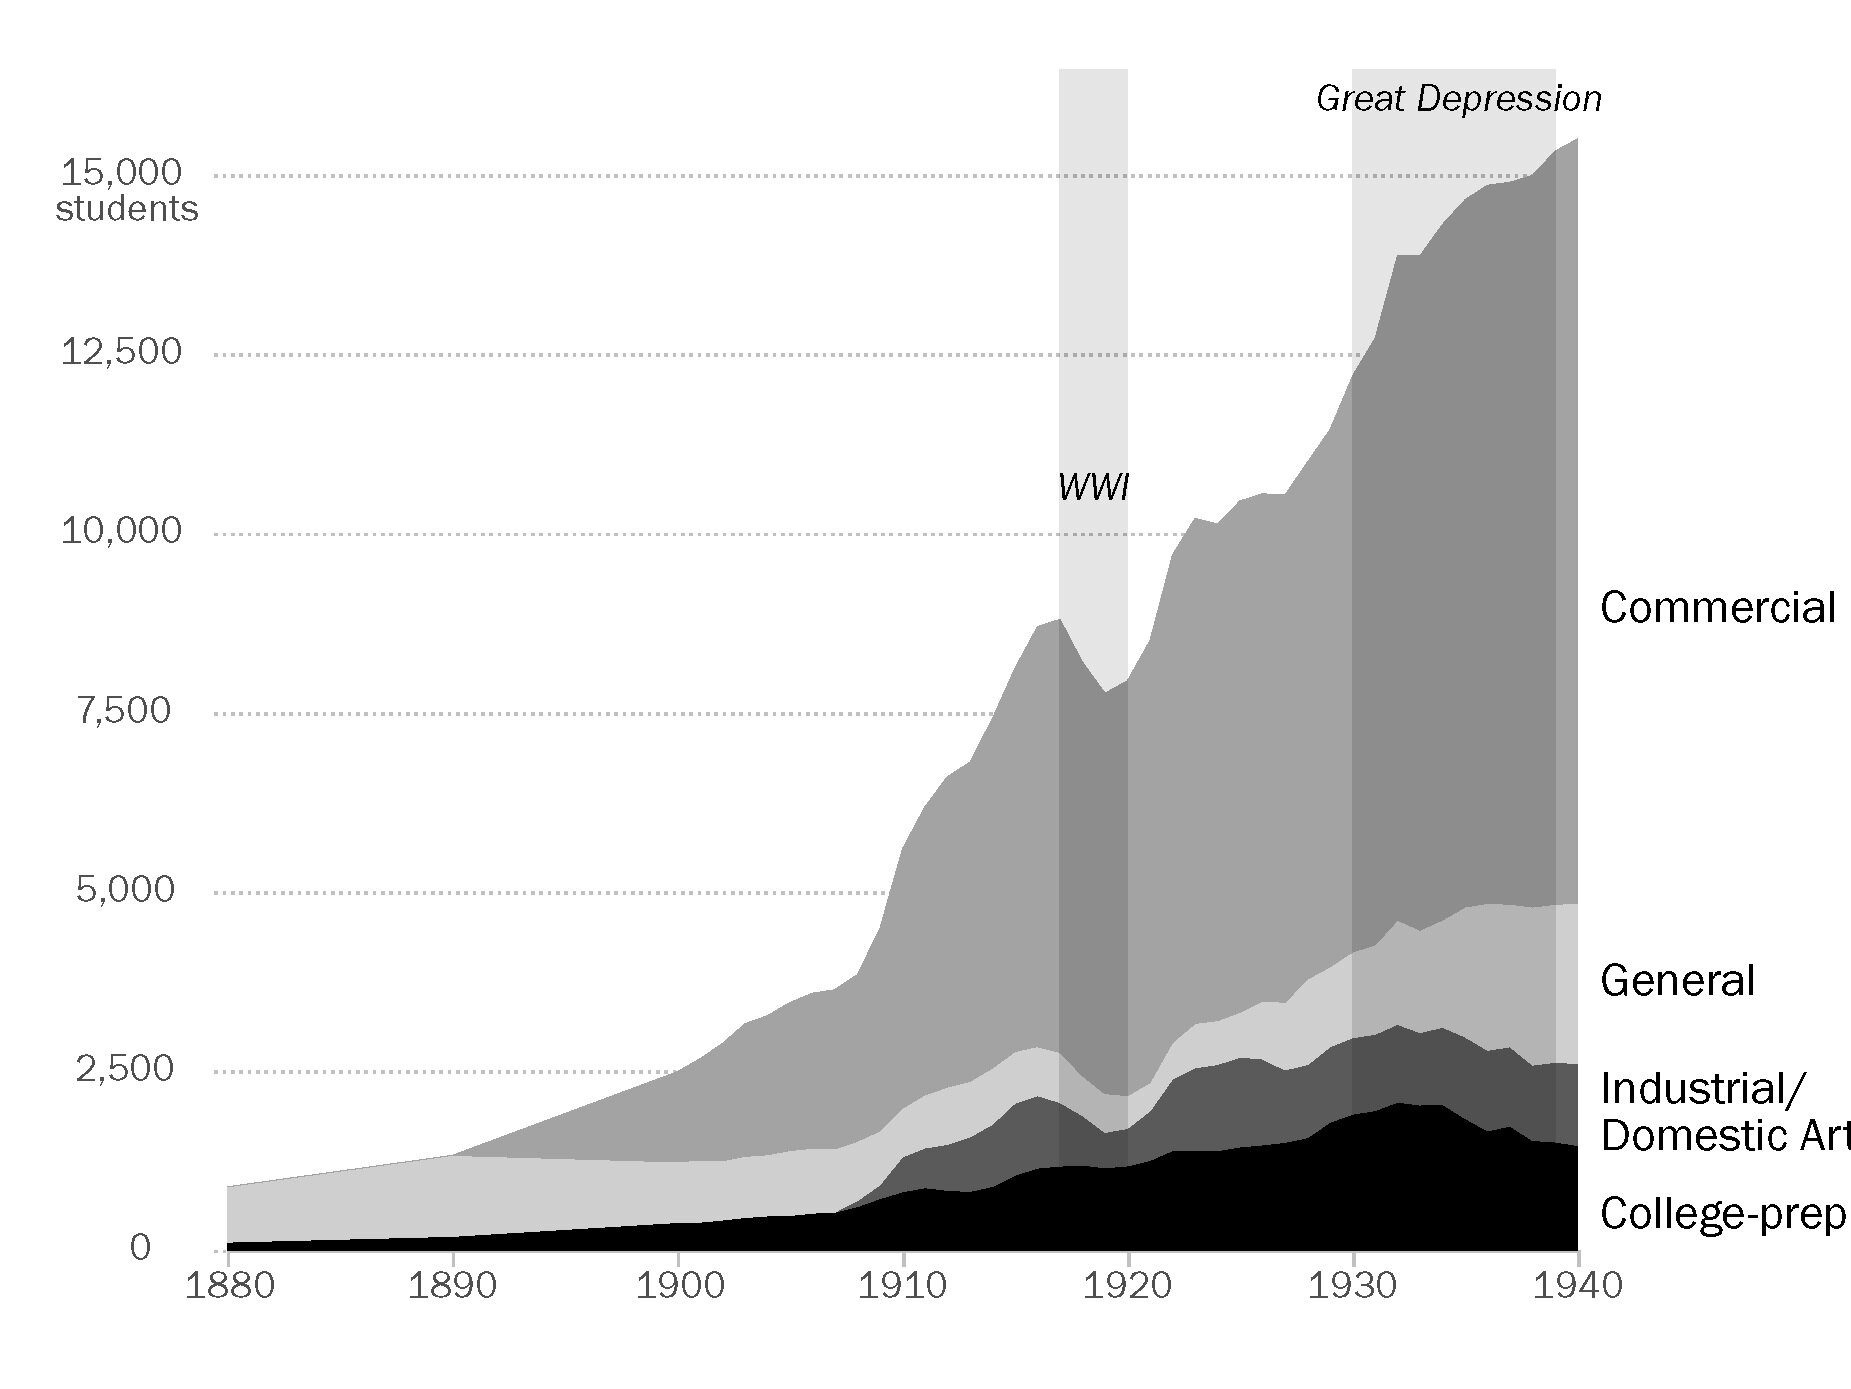
There are 25 charts and maps in this book, designed by Lena V. Groeger, which visualize occupational, demographic, and educational trends. Click here for images.